Changes in Pennsylvania’s State Assessment System: Does It Have an Impact on PVAAS?
PDE’s Executive Leadership, PDE’s Bureau of Assessment and Accountability, along with the PVAAS Statewide Team, work with SAS® EVAAS® as any changes are considered or implemented with Pennsylvania’s statewide assessment system. This work is done to ensure continued and high quality PVAAS reporting for Pennsylvania’s schools. The goal has always been, and will continue to be, to provide fair and meaningful value-added measures for Pennsylvania districts, schools, and educators.
Pennsylvania’s statewide state assessment data is assessed annually to ensure the quality needed to provide value-added reporting at all levels for all students, such as reliability and sufficient stretch to measure the growth of students with higher and lower achievement.
When a gap year occurs in state assessments or a change is made in Pennsylvania’s state standards or state assessments, or even if the assessment is being given for the first time in a particular subject, academic growth as measured by PVAAS can be calculated – as long as sufficient evidence exists regarding the relationships between and among the assessments, as well as the strength of these relationships. Examples of these types of situations include, but are not limited to:
- A gap year in state assessments (which may occur with extended school closures)
- Tests change in rigor, or have a change in level of difficulty
- Tests are transitioned to be aligned to new academic standards
- Tests given for the first time statewide in a particular subject, grade level, or course
- Tests are shortened or lengthened
How can schools be expected to make growth if there is a gap year in state assessments, or if achievement changes significantly statewide?
When a gap occurs in state assessments, such as with extended school closures, it is still possible to measure the academic growth of groups of students in the year the assessments resume – when growth is measured using the PVAAS methodologies. Just like when other types of transitions or changes in testing occur, we may expect the achievement of students to change as a result. Even if the statewide achievement or performance changes significantly, PVAAS assesses whether a group of students exceeded, met, or fell short of the growth standard. For example, when measuring growth for PSSA Math and ELA, the PVAAS growth models analyze whether the group of students maintained their relative position on the statewide distribution of scores relative to themselves. If the group of students maintains the same relative position in the distribution of scores from one year to another (even if the overall statewide distribution of scores is lower), then the group of students will have met the growth standard.
Visual Examples
The following visuals demonstrate how growth is measured, and more importantly, how a group of students can meet the growth standard if (1) the percentage of students reaching proficiency is lower due to an assessment change, or (2) a gap year in state assessments occurs.
In Figure 1 below, the first vertical line represents what could be a year 1 distribution of Grade 6 scores, with scores at the top representing higher achievement while those at the bottom represent lower achievement. The yellow star represents where the student group of Grade 6 students scored relative to the statewide distribution. The second vertical line represents the year 2 distribution of Grade 7 scores. In year 2 of our example, fewer students scored proficient on the state assessment than in year 1, as represented by the yellow star. Remember, though, that the distribution of achievement of all students statewide is lower in our example – meaning fewer students were Proficient in year 2 as compared to year 1.
The question is, “Is the group of students at the same RELATIVE position in the distribution of statewide scores?” This is what PVAAS looks at to determine growth. Notice in this example that they are at the same relative position, which means this group of students met the growth standard, indicated by a green in PVAAS. In other words, these students “maintained their achievement.”
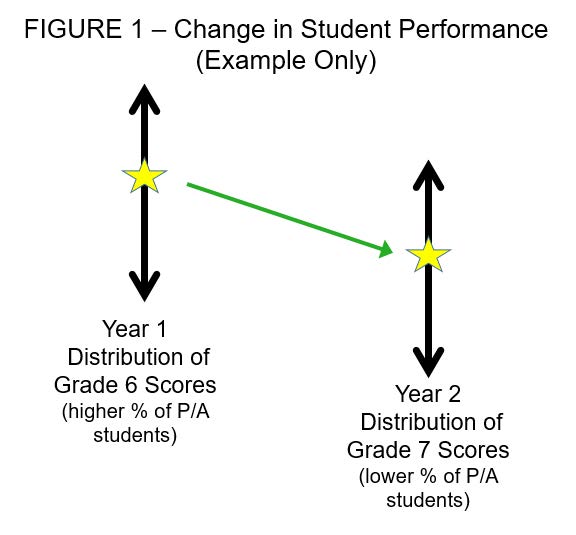
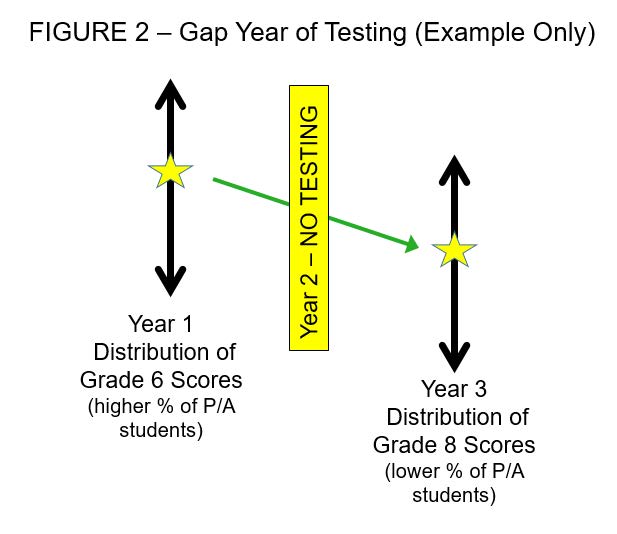
Figure 2 below represents a similar example with one difference. Like the example above, the first vertical line represents what could be a year 1 distribution of Grade 6 scores, with the yellow star represents where the student group of Grade 6 students scored relative to the statewide distribution in that year. The second vertical line, however, now represents the year 3 distribution of Grade 8 scores as a gap year in testing occurred in year 2. In year 3 of this example, fewer students scored proficient on the state assessment than in year 1, as represented by the yellow star. As in the prior example, the distribution of achievement of all students statewide is lower in our example – meaning fewer students were Proficient in year 3 as compared to year 1.
The question again is, “Is the group of students at the same RELATIVE position in the distribution of statewide scores?” They are in fact at the same relative position, which means this group of students met the growth standard, indicated by a green in PVAAS. In other words, these students “maintained their achievement.”
Evidence: PVAAS and Pennsylvania’s Assessment Transition in Prior Years
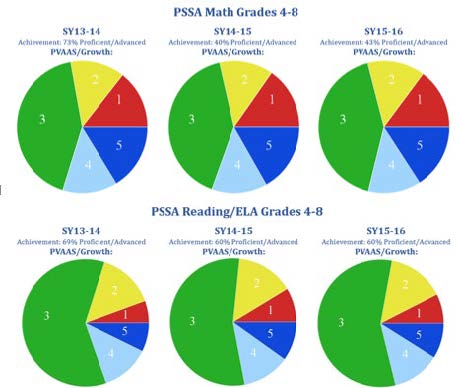
The pie charts on the following page illustrate the distribution of school value-added indicators over three actual school years where a change in state assessments occurred (SY13-14, SY14-15 and SY15-16). This reflects Math and Reading/ELA in grades 4-8. Despite the statewide changes in overall student proficiency from SY13-14 to SY14-15, the distribution of PVAAS value-added indicators has remained consistent (red is the lowest indicator and dark blue is the highest indicator).
More Information
If you have additional questions about changes of Pennsylvania’s state assessment system (including extended school closures) and its impact on PVAAS value-added measures, please email the PVAAS Statewide Team at
pdepvaas@iu13.org.